Frequently asked question
Is it possible to display a layer with more than 200 unique values and 10 colors in Map Viewer?
Yes. Although ArcGIS Online: Types (Unique symbols) states there is an absolute limit of 200 unique values with 10 unique colors to differentiate the types of categorical data, it is possible for Map Viewer to display datasets with more than the set limit of unique values and colors.
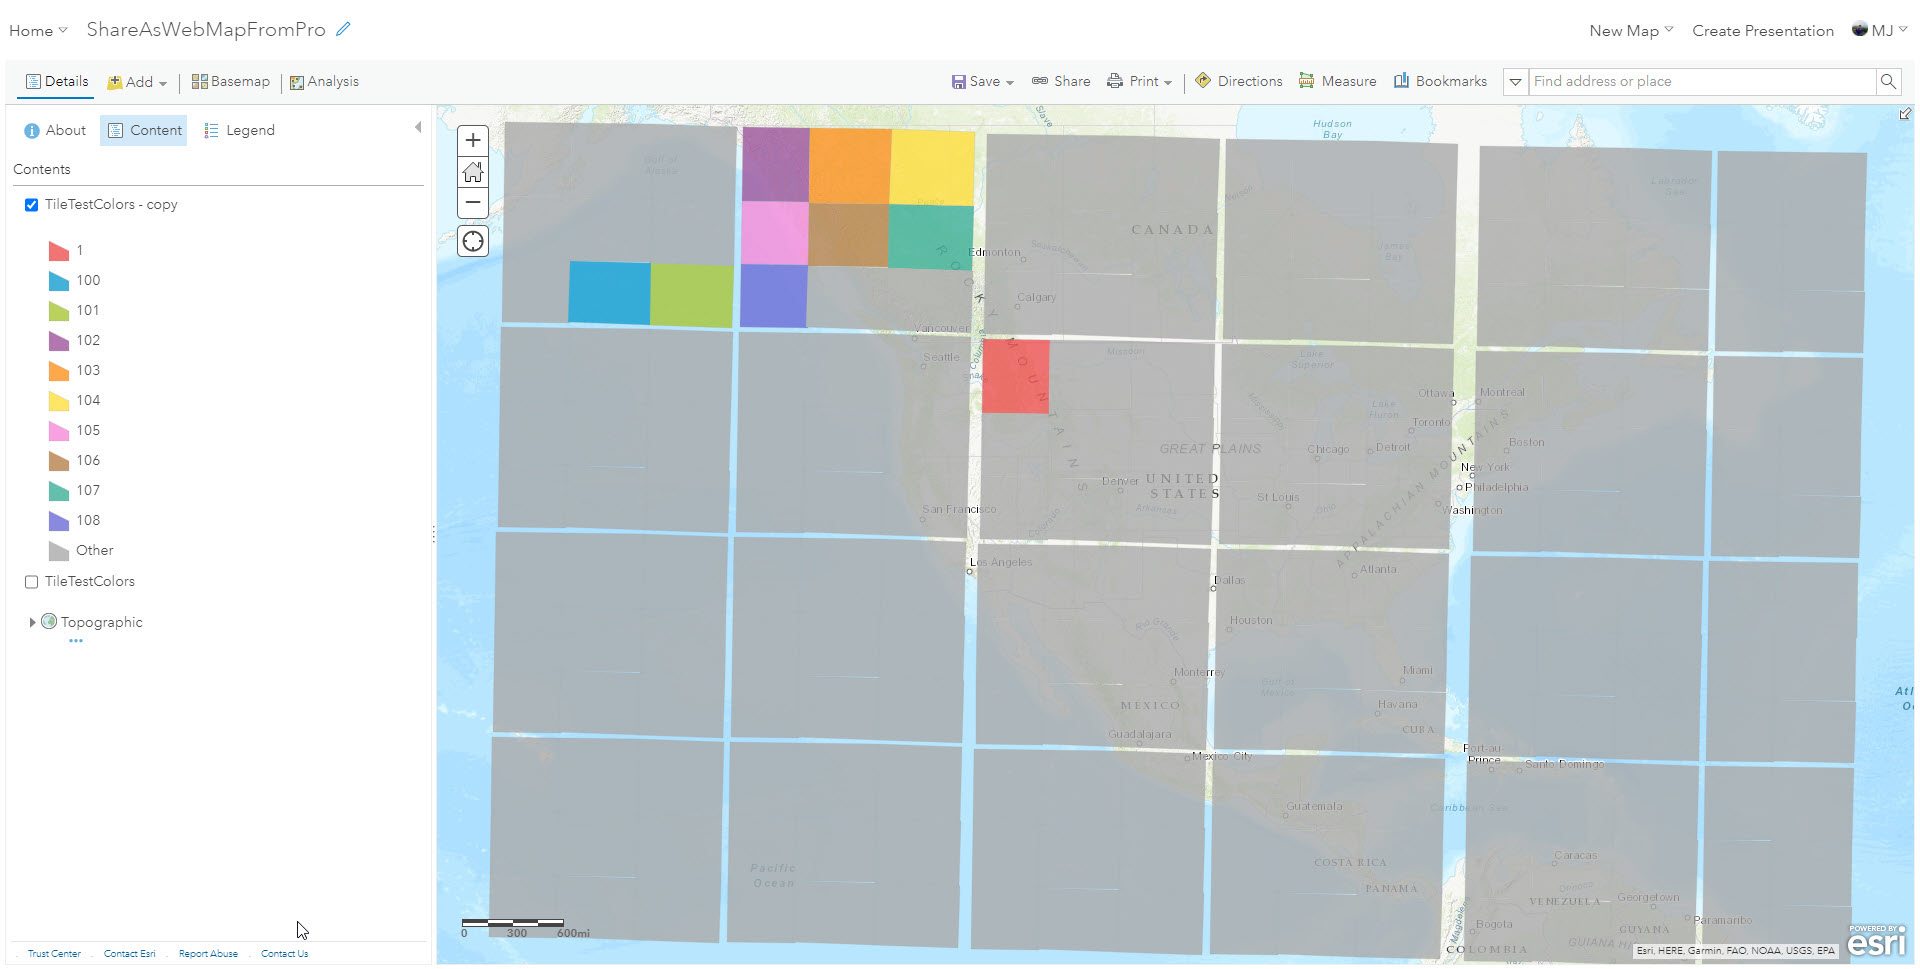
The limitation only applies when creating a layer style through ArcGIS Online Map Viewer. When a style is created for a dataset with more than 200 unique values in Map Viewer, the remaining values are placed under the 'Other' category, with 10 colors representing the multiple categories. For example, the image below shows the layer has more than 200 unique values but is represented by only 10 colors when using Change Style in Map Viewer.
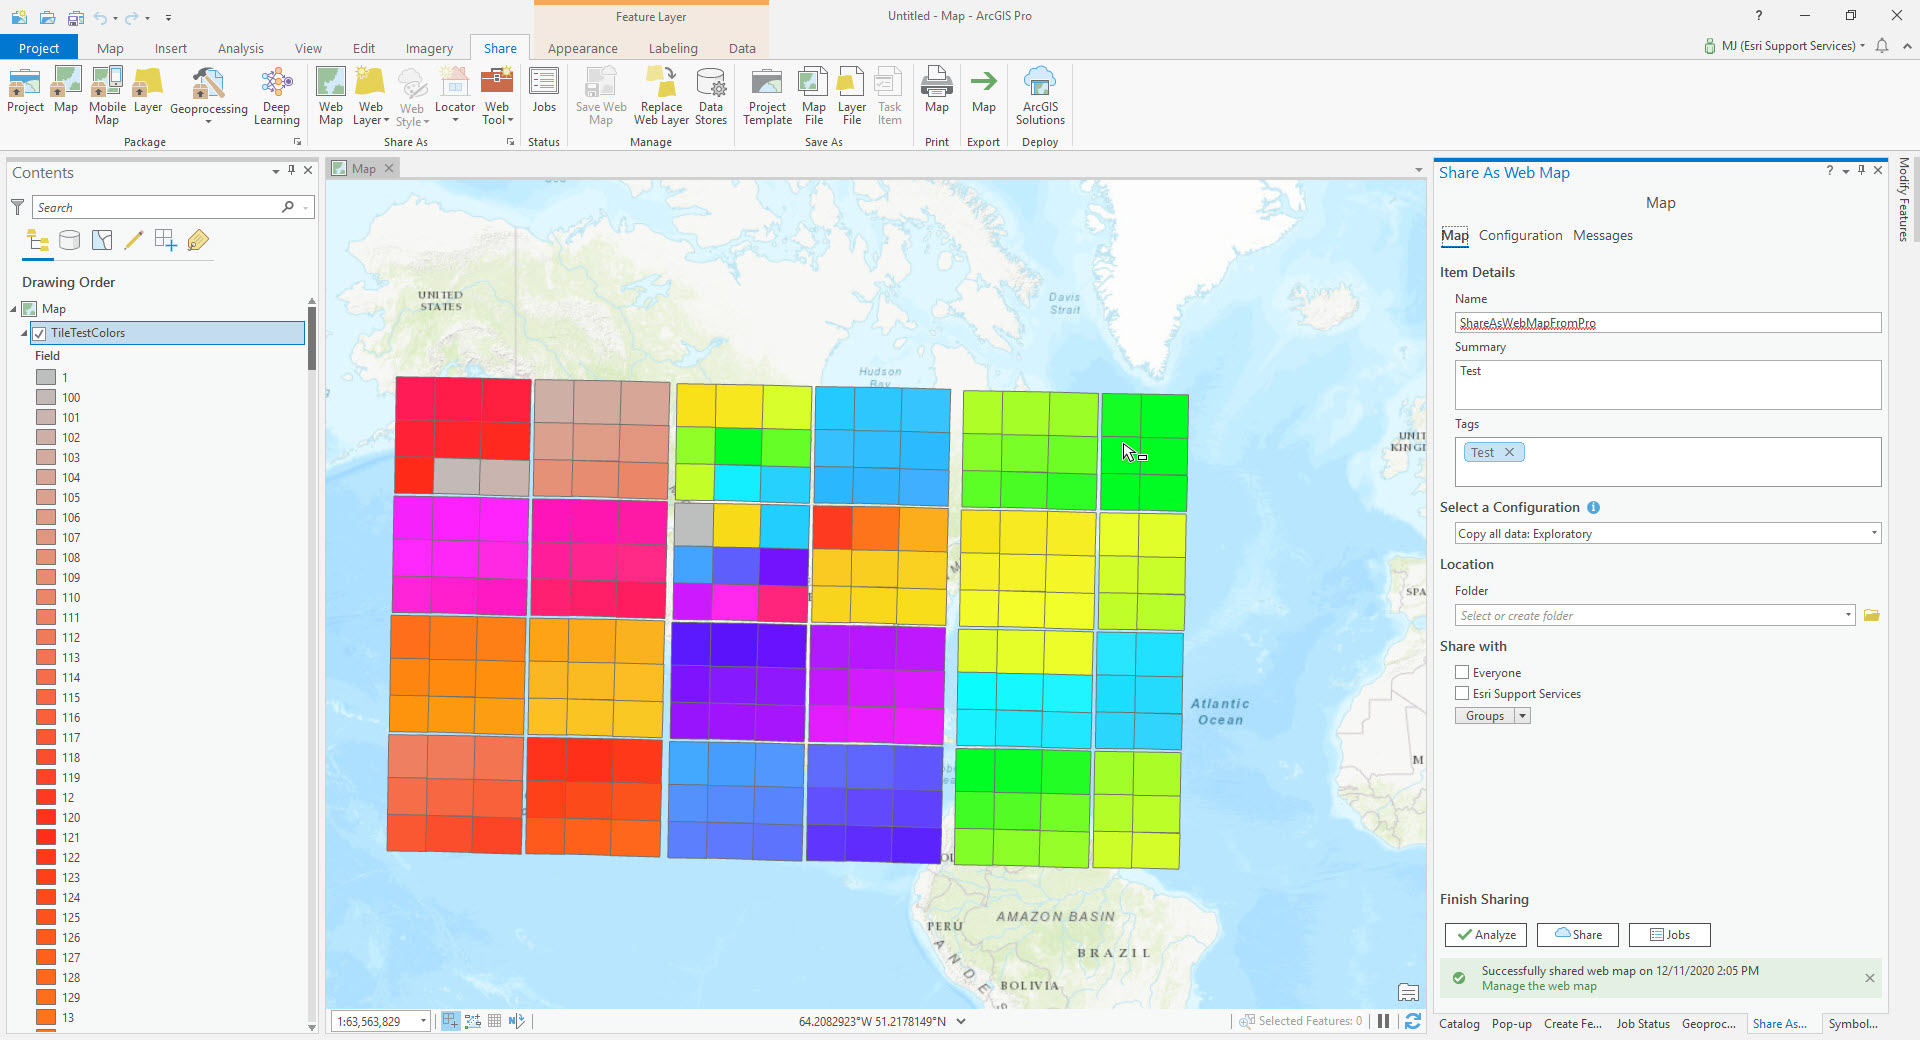
However, datasets can have more than 200 unique values or 10 unique colors in ArcGIS Pro or ArcMap. The image below shows the layer has more than 200 unique values and is represented by more than 10 colors.
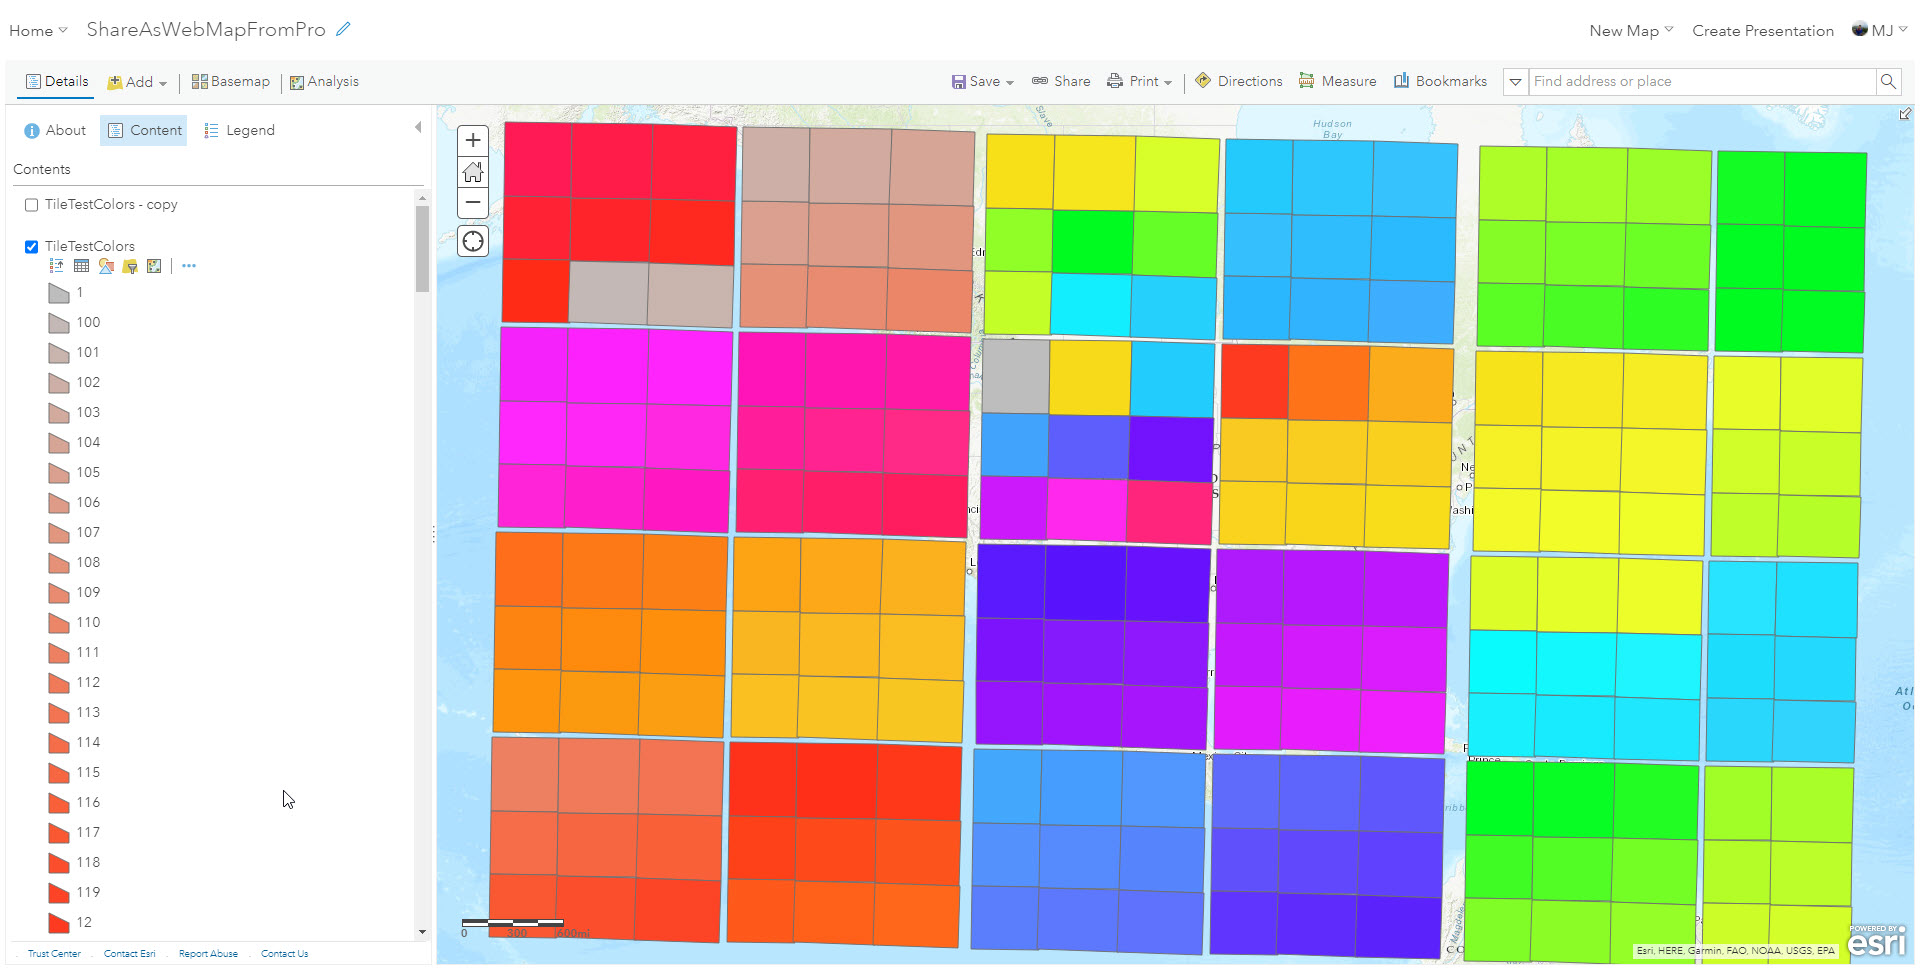
The unique values and colors can be displayed in ArcGIS Online Map Viewer by sharing the layer as a web feature layer or in a web map, as demonstrated in the image below.
Article ID: 000024837
- ArcGIS Online
- ArcMap 10 x
- ArcGIS Pro 2 x
Get support with AI
Resolve your issue quickly with the Esri Support AI Chatbot.


Related Information
Discover more on this topic
Search for related information
Find training related to this topic
Explore ideas and give feedback
Get help from ArcGIS experts
Start chatting now