HOW TO
Configure an Oracle trace file and format the output into a readable text file
Summary
Oracle Trace is a general-purpose event-driven data collection product, which the Oracle server uses to collect performance and resource utilization data, such as SQL parse, execute, and fetch statistics, and wait statistics.
The SQL Trace facility and TKPROF let you accurately assess the efficiency of the SQL statements an application runs.
The SQL Trace facility provides performance information on individual SQL statements. It generates the following statistics for each statement:
- Parse, execute, and fetch counts
- CPU and elapsed times
- Physical reads and logical reads
- Number of rows processed
- Misses on the library cache
- Username under which each parse occurred
- Each commit and rollback
You can run the TKPROF program to format the contents of the trace file and place the output into a readable output file.
This is helpful when troubleshooting Oracle Enterprise geodatabase performance or behavior issues that require a more detailed investigation of the database statistics and SQL statements. Using a database trigger and the TKPROF program, a readable output text file with the SQL trace information can be generated without having to determine the session ID of the connection, as described below.
Procedure
- Create the following trigger in the Oracle database connected as the database user SYS. For the username specify the name of the user that connects to the Enterprise Geodatabase during testing/troubleshooting, as shown in the following example:
create or replace trigger sys.logon_trigger after logon on database
begin
    if user = '<username_in_UPPERCASE>' then
                execute immediate 'alter session set timed_statistics = true';
        execute immediate 'alter session set tracefile_identifier = ''on_logon''';
        execute immediate 'alter session set events ''10046 trace name context forever, level 12'' ' ;
    end if;
end;
- After creating the trigger, open the ArcGIS client (either ArcMap or ArcGIS Pro), connect to the Oracle Enterprise geodatabase and perform the action that causes the unexpected behavior or performance issue(s).
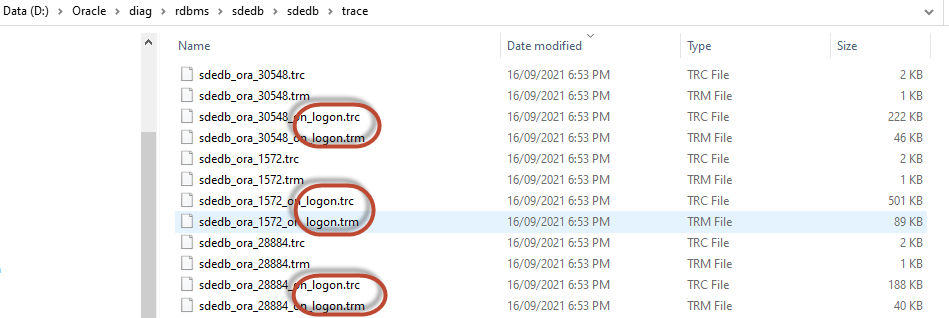
- Navigate to the trace file location on the Oracle database server. The default trace location is located in: ORACLE_HOME\diag\rdbms\your_database\trace. The trace files of interest have the words on_logon appended to the end of the file name.
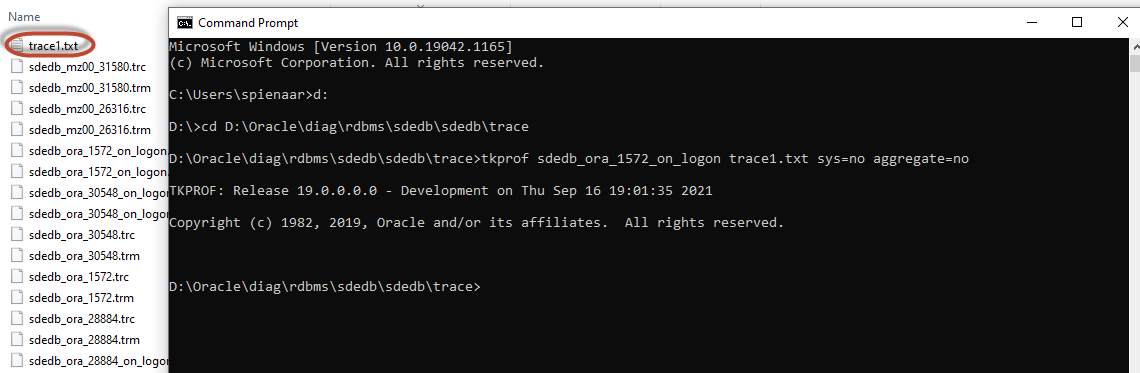
- Using the Windows command prompt, navigate to the Oracle database trace folder and execute the following TKPROF command to convert the trace files into readable text files:
tkprof filename.trc trace.txt sys=no aggregate=no
The text file created in a structure similar to the following:
SELECT LAYER_CONFIG
FROM
 SDE.LAYERS


call     count       cpu    elapsed       disk      query    current        rows
------- ------  -------- ---------- ---------- ---------- ----------  ----------
Parse        1      0.00       0.00          0          0          0           0
Execute      0      0.00       0.00          0          0          0           0
Fetch        0      0.00       0.00          0          0          0           0
------- ------  -------- ---------- ---------- ---------- ----------  ----------
total        1      0.00       0.00          0          0          0           0

Misses in library cache during parse: 0
Optimizer mode: ALL_ROWS
Parsing user id: 108

Elapsed times include waiting on following events:
  Event waited on                             Times   Max. Wait  Total Waited
  ----------------------------------------   Waited  ----------  ------------
  SQL*Net message to client                       1        0.00          0.00
  SQL*Net message from client                     1        0.00          0.00
- Delete the logon trigger once the investigation is done using the following SQL statement:
drop trigger logon_trigger;
Oracle trace files can be used in conjunction with SDEINTERCEPT logs when troubleshooting performance and behavior issues on an Enterprise geodatabase. More details on SDEINTERCEPT logs can be found here: How To: Set up an SDEINTERCEPT log file on a client machine for ArcGIS Desktop and ArcGIS Server
Article ID: 000026435
- ArcMap
- ArcGIS Pro
Get support with AI
Resolve your issue quickly with the Esri Support AI Chatbot.


Related Information
Discover more on this topic
Search for related information
Find training related to this topic
Explore ideas and give feedback
Get help from ArcGIS experts
Start chatting now