HOW TO
Erstellen einer Webkarte aus einer JSON-Datei mit ArcGIS API for Python
Zusammenfassung
In einigen Fällen ist vorteilhaft, eine Webkarte mit einem Skript zu erstellen, da dieses für mehrere Webkarten programmiert werden kann. Mit der in einer JSON-Datei angegebenen Definition kann die Funktion "gis.content.add" in ArcGIS API for Python zur Erstellung der Webkarte verwendet werden.
Vorgehensweise
Webkarten können von einer JSON-Dateirepräsentation mit der Funktion "gis.content.add" im GIS-Modul erstellt werden. Dazu gibt es zwei Möglichkeiten:
- Lesen der JSON-Datei im Skript
- Definieren der JSON-Beschreibung im Skript
Hinweis:
Das Definieren der JSON-Beschreibung nimmt mehr Zeit in Anspruch. Der Benutzer hat dabei jedoch die Möglichkeit, die JSON-Repräsentation des Skripts zu ändern.
Die nachfolgenden Schritte beschreiben, wie Sie eine Webkarte von einer JSON-Datei erstellen, indem Sie sie mit dem JSON-Modul einlesen.
-
Importieren Sie die erforderlichen Module.
from arcgis.gis import GIS
from arcgis.mapping import WebMap
import json
- Geben Sie die Anmeldeinformationen an.
gis = GIS("https://machine.domain.com/portal","adminuser","adminpassword")
print ("Successfully Logged Into GIS: ", gis)
- Öffnen Sie die JSON-Datei.
with open('/home/jupyter/test2.json') as json_data:
	data = json.load(json_data)
- Erstellen Sie die neue Karte.
item_properties_dict = {"type": "Web Map","title": "Test Map","tags": ["test","test1","test2"],"snippet":"This is a snippet", "text":data}

newmap = gis.content.add(item_properties = item_properties_dict)
newmap
Nachfolgend finden Sie das vollständige Skript.
from arcgis.gis import GIS
from arcgis.mapping import WebMap
import json

gis = GIS("https://machine.domain.com/portal","adminuser","adminpassword")
print ("Successfully Logged Into GIS: ", gis)

with open('/home/jupyter/test2.json') as json_data:
	data = json.load(json_data)

item_properties_dict = {"type": "Web Map","title": "Test Map","tags": ["test","test1","test2"],"snippet":"This is a snippet", "text":data}

newmap = gis.content.add(item_properties = item_properties_dict)
newmap
Die folgenden Schritte beschreiben, wie Sie eine Webkarte durch Definieren der JSON-Beschreibung im Skript erstellen.
- Führen Sie die Schritte 1 und 2 der oben beschriebenen Methode durch.
- Definieren Sie das Wörterbuch, das die zur Erstellung der Webkarte verwendete JSON enthält.
data = {
	"operationalLayers": [{
			"id": "layer_2382",
			"layerType": "ArcGISMapServiceLayer",
			"url": "https://sampleserver6.arcgisonline.com/arcgis/rest/services/Census/MapServer",
			"visibility": True,
			"opacity": 1,
			"title": "Census Data",
			"layers": [{
					"id": 0,
					"layerDefinition": {
						"source": {
							"type": "mapLayer",
							"mapLayerId": 0
						}
					},
					"name": "Census Block Points",
					"minScale": 99999.99998945338,
					"maxScale": 0,
					"parentLayerId": -1,
					"defaultVisibility": True
				}, {
					"id": 1,
					"layerDefinition": {
						"source": {
							"type": "mapLayer",
							"mapLayerId": 1
},
						"drawingInfo": {
							"renderer": {
								"type": "simple",
								"label": "",
								"description": "",
								"symbol": {
									"color": [0, 0, 0, 0],
									"outline": {
										"color": [230, 230, 0, 255],
										"width": 0.39975000000000005,
										"type": "esriSLS",
										"style": "esriSLSSolid"
},
									"type": "esriSFS",
									"style": "esriSFSSolid"
}
}
}
},
					"name": "Census Block Group",
					"minScale": 1000000,
					"maxScale": 0,
					"parentLayerId": -1,
					"defaultVisibility": True
				}, {
					"id": 2,
					"layerDefinition": {
						"source": {
							"type": "mapLayer",
							"mapLayerId": 2
},
						"drawingInfo": {
							"renderer": {
								"type": "simple",
								"label": "",
								"description": "",
								"symbol": {
									"color": [0, 0, 0, 0],
									"outline": {
										"color": [230, 230, 0, 255],
										"width": 0.5625,
										"type": "esriSLS",
										"style": "esriSLSSolid"
},
									"type": "esriSFS",
									"style": "esriSFSSolid"
}
}
}
},
					"name": "Detailed Counties",
					"minScale": 0,
					"maxScale": 0,
					"parentLayerId": -1,
					"defaultVisibility": True
				}, {
					"id": 3,
					"layerDefinition": {
						"source": {
							"type": "mapLayer",
							"mapLayerId": 3
},
						"drawingInfo": {
							"renderer": {
								"type": "simple",
								"label": "",
								"description": "",
								"symbol": {
									"color": [0, 0, 0, 0],
									"outline": {
										"color": [230, 230, 0, 255],
										"width": 2,
										"type": "esriSLS",
										"style": "esriSLSSolid"
},
									"type": "esriSFS",
									"style": "esriSFSSolid"
}
}
}
},
					"name": "states",
					"minScale": 0,
					"maxScale": 0,
					"parentLayerId": -1,
					"defaultVisibility": True
}
			]
}
],
	"baseMap": {
		"baseMapLayers": [{
				"id": "labels",
				"layerType": "ArcGISTiledMapServiceLayer",
				"url": "https://services.arcgisonline.com/arcgis/rest/services/Canvas/World_Dark_Gray_Base/MapServer",
				"visibility": True,
				"opacity": 1,
				"title": "World_Dark_Gray_Base"
			}, {
				"id": "base",
				"layerType": "ArcGISTiledMapServiceLayer",
				"url": "https://services.arcgisonline.com/arcgis/rest/services/Canvas/World_Dark_Gray_Reference/MapServer",
				"visibility": True,
				"opacity": 1,
				"title": "World_Dark_Gray_Reference"
}
],
		"title": "Basemap"
},
"spatialReference": {
		"wkid": 102100,
		"latestWkid": 3857
},
	"authoringApp": "WebMapViewer",
	"authoringAppVersion": "10.6.1",
	"version": "2.11"
}
- Erstellen Sie die neue Karte.
item_properties_dict = {"type": "Web Map","title": "Test Map","tags": ["test","test1","test2"],"snippet":"This is a snippet", "text":data}

newmap = gis.content.add(item_properties = item_properties_dict)
newmap
Nachfolgend finden Sie das vollständige Skript.
from arcgis.gis import GIS
from arcgis.mapping import WebMap


gis = GIS("https://earl.esri.com/portal","siteadmin","siteadmin", verify_cert=False)
print ("Successfully Logged Into GIS: ", gis)

data = {
	"operationalLayers": [{
			"id": "layer_2382",
			"layerType": "ArcGISMapServiceLayer",
			"url": "https://sampleserver6.arcgisonline.com/arcgis/rest/services/Census/MapServer",
			"visibility": True,
			"opacity": 1,
			"title": "Census Data",
			"layers": [{
					"id": 0,
					"layerDefinition": {
						"source": {
							"type": "mapLayer",
							"mapLayerId": 0
}
},
					"name": "Census Block Points",
					"minScale": 99999.99998945338,
					"maxScale": 0,
					"parentLayerId": -1,
					"defaultVisibility": True
				}, {
					"id": 1,
					"layerDefinition": {
						"source": {
							"type": "mapLayer",
							"mapLayerId": 1
},
						"drawingInfo": {
							"renderer": {
								"type": "simple",
								"label": "",
								"description": "",
								"symbol": {
									"color": [0, 0, 0, 0],
									"outline": {
										"color": [230, 230, 0, 255],
										"width": 0.39975000000000005,
										"type": "esriSLS",
										"style": "esriSLSSolid"
},
									"type": "esriSFS",
									"style": "esriSFSSolid"
}
}
}
},
					"name": "Census Block Group",
					"minScale": 1000000,
					"maxScale": 0,
					"parentLayerId": -1,
					"defaultVisibility": True
				}, {
					"id": 2,
					"layerDefinition": {
						"source": {
							"type": "mapLayer",
							"mapLayerId": 2
},
						"drawingInfo": {
							"renderer": {
								"type": "simple",
								"label": "",
								"description": "",
								"symbol": {
									"color": [0, 0, 0, 0],
									"outline": {
										"color": [230, 230, 0, 255],
										"width": 0.5625,
										"type": "esriSLS",
										"style": "esriSLSSolid"
},
									"type": "esriSFS",
									"style": "esriSFSSolid"
}
}
}
},
					"name": "Detailed Counties",
					"minScale": 0,
					"maxScale": 0,
					"parentLayerId": -1,
					"defaultVisibility": True
				}, {
					"id": 3,
					"layerDefinition": {
						"source": {
							"type": "mapLayer",
							"mapLayerId": 3
},
						"drawingInfo": {
							"renderer": {
								"type": "simple",
								"label": "",
								"description": "",
								"symbol": {
									"color": [0, 0, 0, 0],
									"outline": {
										"color": [230, 230, 0, 255],
										"width": 2,
										"type": "esriSLS",
										"style": "esriSLSSolid"
},
									"type": "esriSFS",
									"style": "esriSFSSolid"
}
}
}
},
					"name": "states",
					"minScale": 0,
					"maxScale": 0,
					"parentLayerId": -1,
					"defaultVisibility": True
}
			]
}
],
	"baseMap": {
		"baseMapLayers": [{
				"id": "labels",
				"layerType": "ArcGISTiledMapServiceLayer",
				"url": "https://services.arcgisonline.com/arcgis/rest/services/Canvas/World_Dark_Gray_Base/MapServer",
				"visibility": True,
				"opacity": 1,
				"title": "World_Dark_Gray_Base"
			}, {
				"id": "base",
				"layerType": "ArcGISTiledMapServiceLayer",
				"url": "https://services.arcgisonline.com/arcgis/rest/services/Canvas/World_Dark_Gray_Reference/MapServer",
				"visibility": True,
				"opacity": 1,
				"title": "World_Dark_Gray_Reference"
}
],
		"title": "Basemap"
},
"spatialReference": {
		"wkid": 102100,
		"latestWkid": 3857
},
	"authoringApp": "WebMapViewer",
	"authoringAppVersion": "10.6.1",
	"version": "2.11"
}

item_properties_dict = {"type": "Web Map","title": "Test Map","tags": ["test","test1","test2"],"snippet":"This is a snippet", "text":data}

newmap = gis.content.add(item_properties = item_properties_dict)
newmap
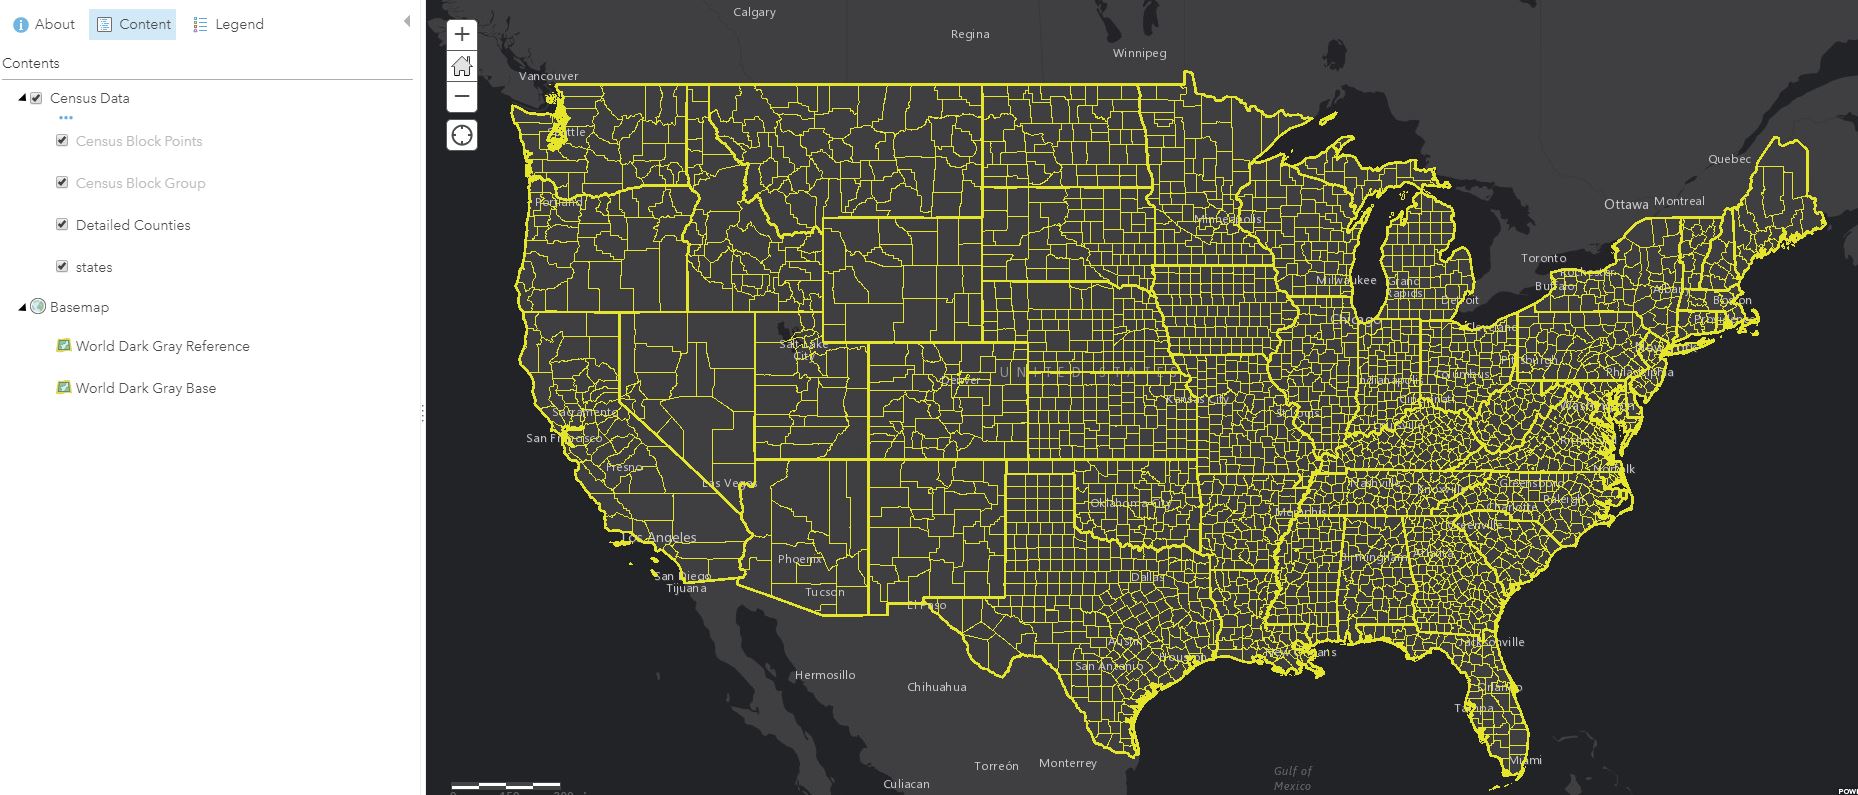
Das folgende Bild zeigt die neu erstellte Webkarte.
Artikel-ID: 000019701
Holen Sie sich Unterstützung mit KI
Lösen Sie Ihr Problem schnell mit dem Esri Support AI Chatbot.


Zugehörige Informationen
Weitere Informationen zu diesem Thema erkunden
Search for related information
Find training related to this topic
Explore ideas and give feedback
Unterstützung durch ArcGIS-Experten anfordern
Beginnen Sie jetzt mit dem Chatten